
NSDT工具推荐: Three.js AI纹理开发包 - YOLO合成数据生成器 - GLTF/GLB在线编辑 - 3D模型格式在线转换 - 可编程3D场景编辑器 - REVIT导出3D模型插件 - 3D模型语义搜索引擎 - AI模型在线查看 - Three.js虚拟轴心开发包 - 3D模型在线减面 - STL模型在线切割 - 3D道路快速建模
作为点云 Open3D-ML 实验的一部分,我撰写了文章解释如何使用 Tensorflow 和 PyTorch 支持安装此库。 为了测试安装,我解释了如何运行一个简单的 Python 脚本来可视化名为 SemanticKITTI 的语义分割标记数据集。 在本文中,我将回顾在任何点云上进行推理的步骤,包括 SemanticKITTI 的测试部分以及我的私人数据集。
本文的其余部分假设你已按照我的上一篇文章成功安装并使用 PyTorch 后端测试了 Open3D-ML。 完成此操作也意味着你已经下载了 SemanticKITTI 数据集。 要对未标记的数据运行语义分割模型,你需要加载 Open3D-ML 管道。 该管道将包含语义分割模型、数据集以及可能的其他预处理/后处理步骤。 Open3D-ML 附带模块和配置文件,可以轻松加载和运行流行的管道。
为了对新点云进行推理,我们将使用一种名为 RandLA-Net 的流行模型,该模型在 2019 年题为 RandLA-Net:大规模点云的高效语义分割的论文中提出。 方便的是,Open3D-ML 具有此方法的实现,并且具有在 SemanticKITTI 数据集上加载和运行此类方法的配置,无需太多努力。
要加载配置文件,我们需要以下代码,确保将 /path/to/Open3D/ 替换为安装时克隆 Open3D 存储库的路径。
# Load an ML configuration file
cfg_file = "/path/to/Open3D/build/Open3D-ML/ml3d/configs/randlanet_semantickitti.yml"
cfg = _ml3d.utils.Config.load_from_file(cfg_file)
接下来,我们将使用配置对象创建 RandLANet 模型,并将路径添加到 SemanticKITTI 数据集以及我们的自定义数据集。 确保将 /path/to/save/dataset/SemanticKitti/ 替换为安装 Open3D-ML 时保存 SemanticKITTI 数据的路径。 目前,自定义数据集指向我的机器人收集的一些个人点云,并在本文随附的存储库中提供。
# Load the RandLANet model
model = ml3d.models.RandLANet(**cfg.model)
# Add path to the SemanticKitti dataset and your own custom dataset
cfg.dataset['dataset_path'] = '/path/to/save/dataset/SemanticKitti/'
cfg.dataset['custom_dataset_path'] = './pcds'
下一步是加载数据集。 为了加载 SementicKITTI 数据集,Open3D-ML 具有方便的帮助器类和方法。
# Load the datasets
dataset = ml3d.datasets.SemanticKITTI(cfg.dataset.pop('dataset_path', None), **cfg.dataset)
custom_dataset = load_custom_dataset(cfg.dataset.pop('custom_dataset_path', None))
添加了一个简单的自定义函数来加载自定义数据集。 请注意,该数据集必须采用 PCD 格式。
def load_custom_dataset(dataset_path):
 print("Loading custom dataset")
 pcd_paths = glob.glob(dataset_path+"/*.pcd")
 pcds = []
 for pcd_path in pcd_paths:
  pcds.append(o3d.io.read_point_cloud(pcd_path))
 return pcds
接下来,使用配置、模型和数据集对象创建管道。 如果不可用,则在加载到管道之前下载模型参数(检查点)。
# Create the ML pipeline
pipeline = ml3d.pipelines.SemanticSegmentation(model, dataset=dataset, device="gpu", **cfg.pipeline)
# Download the weights.
ckpt_folder = "./logs/"
os.makedirs(ckpt_folder, exist_ok=True)
ckpt_path = ckpt_folder + "randlanet_semantickitti_202201071330utc.pth"
randlanet_url = "https://storage.googleapis.com/open3d-releases/model-zoo/randlanet_semantickitti_202201071330utc.pth"
if not os.path.exists(ckpt_path):
    cmd = "wget {} -O {}".format(randlanet_url, ckpt_path)
    os.system(cmd)
# Load the parameters of the model.
pipeline.load_ckpt(ckpt_path=ckpt_path)
为了在 SemanticKITTI 测试集中的未标记点云上运行模型,我们首先按索引选择给定的数据点,然后从管道运行推理操作。 你可以更改变量 pc_idx 的值来选择另一个点云。
# Get one test point cloud from the SemanticKitti dataset
pc_idx = 58 # change the index to get a different point cloud
test_split = dataset.get_split("test")
data = test_split.get_data(pc_idx)
# run inference on a single example.
# returns dict with 'predict_labels' and 'predict_scores'.
result = pipeline.run_inference(data)
SemanticKITTI 数据集中的点云数据实例作为包含键“point”、“feat”和“label”的 Python 字典加载。 最后两个分别有 None 和一个用 0 填充的 Numpy 数组作为值,并且在推理过程中不使用。 “point”键与包含 LiDAR 点的 x、y 和 z 坐标的 Numpy 数组关联。 为了使用 Open3D 可视化工具可视化推理结果,我们需要从字典的“point”部分创建一个点云对象,然后使用推理返回的标签对点进行着色。
# Create a pcd to be visualized
pcd = o3d.geometry.PointCloud()
xyz = data["point"] # Get the points
pcd.points = o3d.utility.Vector3dVector(xyz)
# Get the color associated with each predicted label
colors = [COLOR_MAP[clr] for clr in list(result['predict_labels'])]
pcd.colors = o3d.utility.Vector3dVector(colors) # Add color data to the point cloud
# Create visualization
custom_draw_geometry(pcd)
SemanticKITTI 数据集有 19 个类以及一个背景类。 必须提供从类标签到点颜色的颜色映射。 为了便于阅读,RGB 颜色被定义为整数,但可视化工具使用从 0.0 到 1.0 的双精度数,因此提供了一些进行转换的代码。
# Class colors, RGB values as ints for easy reading
COLOR_MAP = {
    0: (0, 0, 0),
    1: (245, 150, 100),
    2: (245, 230, 100),
    3: (150, 60, 30),
    4: (180, 30, 80),
    5: (255, 0., 0),
    6: (30, 30, 255),
    7: (200, 40, 255),
    8: (90, 30, 150),
    9: (255, 0, 255),
    10: (255, 150, 255),
    11: (75, 0, 75),
    12: (75, 0., 175),
    13: (0, 200, 255),
    14: (50, 120, 255),
    15: (0, 175, 0),
    16: (0, 60, 135),
    17: (80, 240, 150),
    18: (150, 240, 255),
    19: (0, 0, 255),
}
# Convert class colors to doubles from 0 to 1, as expected by the visualizer
for label in COLOR_MAP:
 COLOR_MAP[label] = tuple(val/255 for val in COLOR_MAP[label])
用语义分割的结果绘制点云的自定义函数如下:
def custom_draw_geometry(pcd):
vis = o3d.visualization.Visualizer()
vis.create_window()
vis.get_render_option().point_size = 2.0
vis.get_render_option().background_color = np.asarray([1.0, 1.0, 1.0])
vis.add_geometry(pcd)
vis.run()
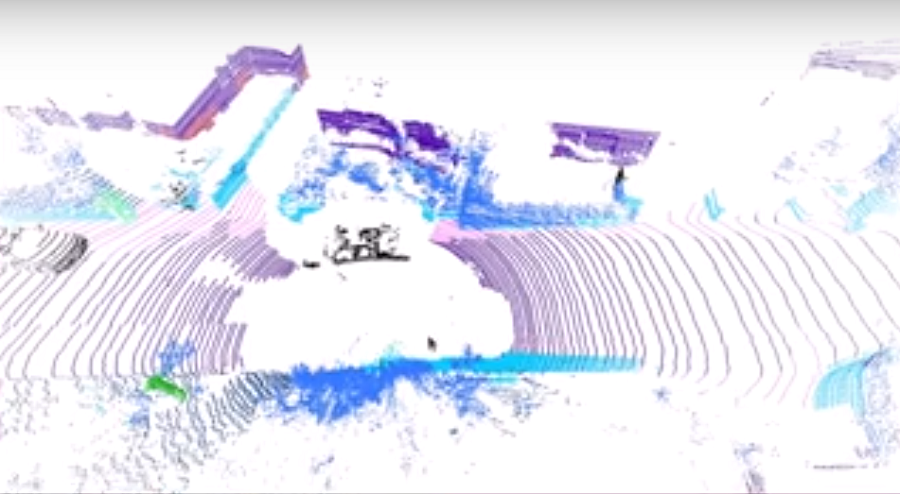
vis.destroy_window()为了对我们的私人数据进行推理,我们遵循类似的过程。 提供所需数据点的索引,并在将结果字典传递到管道之前执行加载和预处理 PCD 文件的自定义函数。 然后,我们对分割的点云进行着色并显示。
# Get one test point cloud from the custom dataset
pc_idx = 2 # change the index to get a different point cloud
data, pcd = prepare_point_cloud_for_inference(custom_dataset[pc_idx])
# Run inference
result = pipeline.run_inference(data)
# Colorize the point cloud with predicted labels
colors = [COLOR_MAP[clr] for clr in list(result['predict_labels'])]
pcd.colors = o3d.utility.Vector3dVector(colors)
# Create visualization
custom_draw_geometry(pcd)
准备数据的自定义函数接收从 PCD 列表获得的 PCD,删除非有限点(nan 和 +/-inf 值),从 PCD 获取点数据,并用它构建适合管道的字典 。 然后它返回 PCD 和字典。
def prepare_point_cloud_for_inference(pcd):
 # Remove NaNs and infinity values
 pcd.remove_non_finite_points()
 # Extract the xyz points
 xyz = np.asarray(pcd.points)
 # Set the points to the correct format for inference
 data = {"point":xyz, 'feat': None, 'label':np.zeros((len(xyz),), dtype=np.int32)}
return data, pcd
要运行代码并亲自查看结果,请激活 Conda 环境并按照以下步骤操作。
第 1 步:克隆存储库
git clone https://github.com/carlos-argueta/open3d_experiments.git第 2 步:运行代码
cd open3d_experiments
python3 semantic_torch.py
第 3 步:故障排除
如果出现错误:
RuntimeError: Expected all tensors to be on the same device, but found at attestate at the attesting all devices, cpu and cuda:0! 打开文件 /path/to/your/conda-env/lib/python3.9/site-packages/open3d/_ml3d/torch/modules/losses/semseg_loss.py,确保替换 /path/to/your/conda -env 为你的 Conda 环境路径,替换python3.9 为你的 Python 版本。
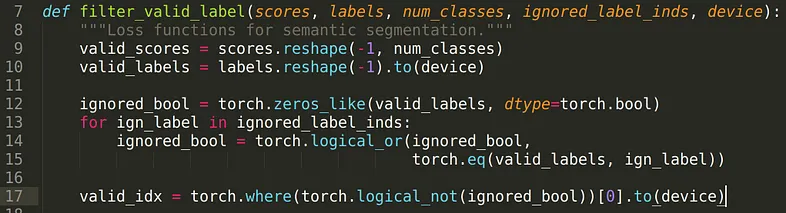
接下来,找到第 9 行并在其末尾添加 .to(device):
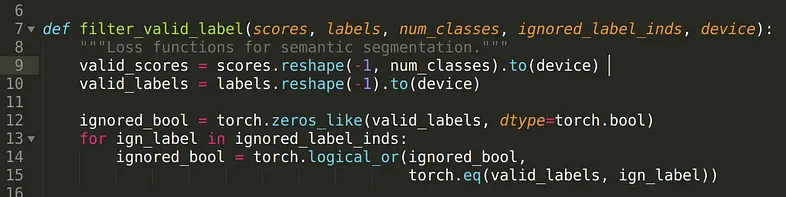
关闭并保存文件,这应该可以解决问题。
如果出现错误: ModuleNotFoundError:no module named 'tensorboard',则运行:
pip install tensorboard第四步:享受吧!
原文链接:Semantic Segmentation with Open3D-ML, PyTorch Backend, and a Custom Dataset
BimAnt翻译整理,转载请标明出处


