NSDT工具推荐: Three.js AI纹理开发包 - YOLO合成数据生成器 - GLTF/GLB在线编辑 - 3D模型格式在线转换 - 可编程3D场景编辑器 - REVIT导出3D模型插件 - 3D模型语义搜索引擎 - AI模型在线查看 - Three.js虚拟轴心开发包 - 3D模型在线减面 - STL模型在线切割 - 3D道路快速建模
在我之前关于构建生成文本应用程序的文章中,我提到我将分享一篇关于如何在数据分析场景中使用 LLM 的新文章。 因此,在这篇文章中,我将与令人兴奋的 Pandas AI 库分享我的实验,它可以让你进行对话式数据科学。 让我们看看这如何改变数据工程师和分析师的游戏规则。
Panda AI 是一个开源项目,通过引入生成式 AI 功能来扩展流行的 Pandas 的功能。 用户可以使用自然语言提示与其数据框进行交互。 这节省了编写复杂查询的大量时间,并使数据分析师的体验非常直观和顺畅。
以下是实现这一魔力的关键步骤:
- 使用熟悉的 Pandas 库作为 Dataframe 摄取数据。
- 实例化一个类似 OpenAI GPT 模型的 LLM 并将其连接到 Pandas AI。
- 提交用户提示或有关上传数据的问题。
- LLM 处理请求并生成 Python 代码以对输入数据执行,以解决上述用户查询。
- 系统执行Python代码并返回结果。
- 结果被转换为易于理解的会话格式并返回给用户。
首先我导入 pandas 库:
import pandas as pd
from pandasai import PandasAI
接下来,我读取从 OpenAI GPT 模型综合生成的 CSV 格式的购物者数据。 因此,数据生成是一种有用的功能,即使对于测试等领域也是如此:
shopperDF = pd.read_csv('data.csv')
shopperDF.head()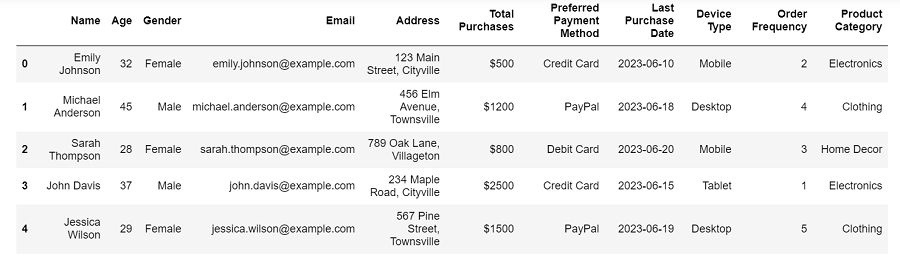
然后我将 Pandas AI 与 openai LLM 连接起来。
from pandasai.llm.openai import OpenAI
llm = OpenAI()
pandas_ai = PandasAI(llm, conversational=True, verbose=False)
清除以前响应的缓存是个好主意。
pandas_ai.clear_cache()第一个查询是一个简单的查询,用于查看跨类别的最高支出者详细信息。
prompt="Display the top spenders along with their names, age and gender within each prdouct category"

result = pandas_ai(shopperDF, prompt)
print(result)
查询的答案如下所示:
The top spenders for each product category, along with their names, age, and gender are: Matthew Baker (30 years old, male) for Clothing, Daniel White (35 years old, male) for Electronics, and Joseph Anderson (44 years old, male) for Home Decor. They have spent a total of $3000, $3500, and $2000 respectively in their respective categories.接下来,我会询问特定类别中支出最高的人。
prompt= "who are the big spenders in clothing and electronics?"

result2 = pandas_ai(shopperDF, prompt)
print(result2)
结果看起来依然不错:
According to the data, the big spenders in clothing and electronics are Samuel Turner and Daniel White, both spending a total of 3500. Andrew Cooper and Benjamin Roberts come in second with a total of 3200, followed by Noah Campbell with 3100.接下来的查询逐渐增加了更多的复杂性,Pandas AI 表现得非常好!
prompt="Summarize the purchases of top shoppers in electronics category"
result3 = pandas_ai(shopperDF, prompt)
print(result3)
'''
The top shoppers in the electronics category are Daniel White and Samuel Turner, who both made purchases totaling $3500. Andrew Cooper and Benjamin Roberts also spent big, with $3200 in purchases each. Noah Campbell rounds out the list with $3100 in total purchases.
'''
prompt="How does the average spend compare across device types? "
result4 = pandas_ai(shopperDF, prompt)
print(result4)
'''
On average, people spend $1,526.67 on desktops, $1,281.25 on mobile devices, and $2,450 on tablets when making purchases.
'''
prompt="How does the average spend compare across categories with and without including home decor? "
result4 = pandas_ai(shopperDF, prompt)
print(result4)
'''
If we include home decor, the average spend for clothing is $1742.86, electronics is $1953.33, and home decor is $1183.33. However, if we exclude home decor, the average spend for clothing and electronics remains the same.
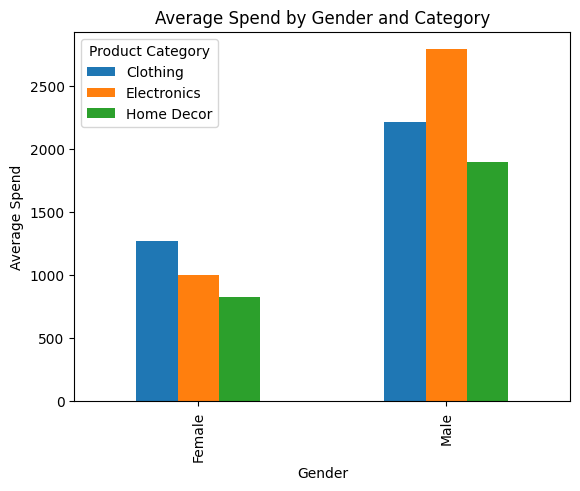
Next comes the most interesting part. You can generate visualizations from data by just prompting the request.
'''
prompt="Plot the bar graph that displays the average spend for males and females by category"
pandas_ai( shopperDF, prompt)
prompt="Plot the bar graph that displays the average spend for customer by device type and by category"

pandas_ai( shopperDF, prompt)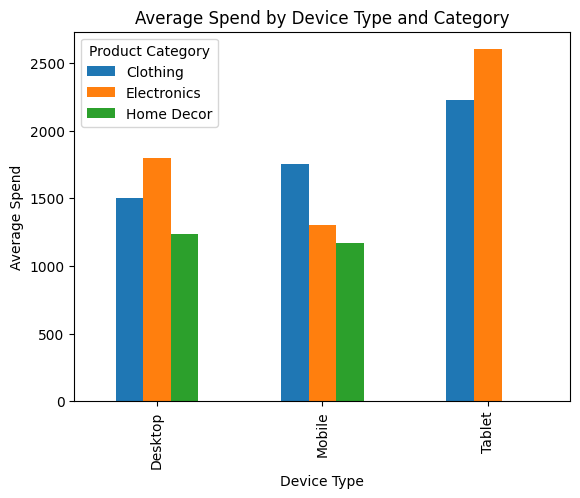
接下来,我要求 Pandas AI 使用其 API 端点生成相关热图。
pandas_ai.plot_correlation_heatmap(shopperDF)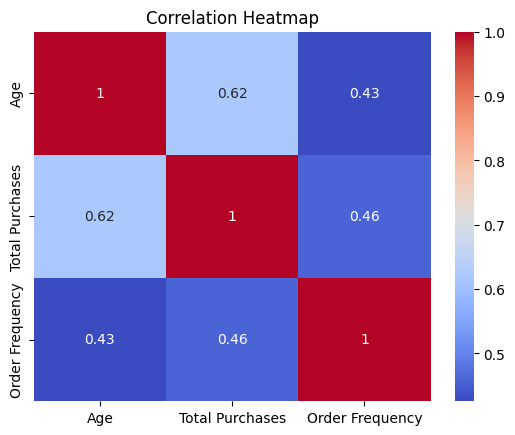
因此,正如我们所看到的,这确实是一个游戏规则改变者,因为你可以通过对话方式查询和可视化结构化数据。 此外,你还可以扩充数据、添加更多列、识别有用的机器学习功能、估算缺失值,甚至利用 Pandas AI 的LLM的强大功能来清理数据。
原文链接:Talk to your Tabular data using LLMs
BimAnt翻译整理,转载请标明出处