NSDT工具推荐: Three.js AI纹理开发包 - YOLO合成数据生成器 - GLTF/GLB在线编辑 - 3D模型格式在线转换 - 可编程3D场景编辑器 - REVIT导出3D模型插件 - 3D模型语义搜索引擎 - AI模型在线查看 - Three.js虚拟轴心开发包 - 3D模型在线减面 - STL模型在线切割 - 3D道路快速建模
OpenStreetMap 是一个被称为地图世界的维基百科的项目。 它由来自世界各地的贡献者构建。 OSM 可以代表我们这个世界的视觉符号,展示我们曾经去过或将要去的每个地方的完美理念。 OpenStreetMap (OSM) 现在处于世界上最大和最富有的科技公司联盟的中心。 世界上最大的公司都在使用 OSM 作为最常用软件的关键基础设施。
如果我们遇到麻烦或想要找到我们最需要的地方,OpenStreetMap 就是解决方案。
在这篇文章中,我们将编写一个 python 脚本,它使用 OSM(开放街道地图)API 来定位离我们最近的医院,并根据它们的评级、位置和空床位数量来选择它们。 我们使用一个 API 输出,其中包含医院列表、它们的评级、位置和空床位数量。 在这个系统中,我们使用数据集文件和 OpenStreetMap API 检索医院列表及其与起点的距离,并找到我们必须在最短时间内到达终点的最短距离。 我们的案例研究地点是洛杉矶,我们将使用图形、节点和边来构建我们的地图。
1、环境搭建
基础的开发环境要求如下:
- Python编程语言
- Pyrosm:一个 Python 库,用于将 OpenStreetMap 从 Protocolbuffer 二进制格式文件 (*.osm.pbf) 读取到 Geopandas GeoDataFrames 中。 Pyrosm 可以通过 conda 或 pip 包管理器安装。
使用 pip 命令安装 Pyrosm:
pip install pyrosm或者使用 conda 安装 Pyrosm:
conda install -c conda-forge pyrosm- pandas
pandas 是一种快速、强大、灵活且易于使用的开源数据分析和操作工具,构建于 Python 编程语言之上。
使用 pip 安装 pandas 库:
pip install pandas或者使用 conda 安装 pandas 库:
conda install pandas- numpy
NumPy 是 Python 中科学计算的基础包。 它是一个Python库,提供多维数组对象,各种派生对象。
使用 pip 安装 numpy 库:
pip install numpy或者使用 conda 安装 numpy 库:
conda install numpy- geopandas
GeoPandas 是一个开源项目,可以更轻松地在 Python 中处理地理空间数据。 GeoPandas 扩展了 pandas 使用的数据类型,以允许对几何类型进行空间操作。
使用 pip 安装 Geopandas:
pip install geopandas或者使用 conda 安装 Geopandas:
conda install geopandas- networkx
NetworkX 是一个 Python 包,用于创建、操作和研究复杂网络的结构、动力学和功能。
pip install networkx- igraph
igraph 在 Python Package Index 上,带有适用于大多数 Python 发行版和平台的预编译版本。
pip install igraph- osmnx
OSMnx 是一个 Python 包,可让你从 OpenStreetMap 下载地理空间数据,并对真实世界的街道网络和任何其他地理空间几何图形进行建模、投影、可视化和分析。
conda config --prepend channels conda-forge- folium
folium 在 Python 中处理你的数据,然后在地图上将其可视化。
pip install folium2、用于检索医院的 API
我们将假设 API json 输出是下面的 json 文件:
[
    {
       "id":"1",
       "name":"Southern California Hospital at Hollywood",
       "lat":"34.1118016",
       "long":"-118.2848717",
       "score":68,
       "empty_bed":10,
       "specialities":[
           "eye",
           "ear"
       ]
    },
    {
       "id":"2",
       "name":"Keck Hospital of USC",
       "lat":"35.7131699",
       "long":"51.3784919",
       "score":30,
       "empty_bed":20,
       "specialities":[
           "eye",
           "ear"
        ]
    },
    {
       "id":"3",
       "name":"Southern California Hospital at Culver City",
       "lat":"35.7131699",
       "long":"51.3784919",
       "score":32,
       "empty_bed":30,
       "specialities":[
           "eye",
           "ear"
        ]
    },
    {
       "id":"4",
       "name":"Dignity Health - California Hospital Medical Center",
       "lat":"36.38220428075101",
       "long":"-119.01566748685103",
       "score":53,
       "empty_bed":66,
       "specialities":[
           "eye",
           "ear"
        ]
    },
    {
       "id":"5",
       "name":"LAC+USC Medical Center",
       "lat":"33.93997997052091",
       "long":"-118.63514061133456",
       "score":43,
       "empty_bed":33,
       "specialities":[
            "eye",
            "ear"
        ]
    }
]
我们现在将在下面导入所需的库。
from pyrosm import OSM, get_data
import geopandas as gpd
import pandas as pd
from sklearn.neighbors import BallTree
import numpy as np
import mapclassify as mc
import matplotlib.pyplot as plt
import time
import networkx as nx
import igraph as ig
import osmnx as ox
import folium
import json
Loader.py内容如下:
osm = OSM(get_data("Southern California"))
graph_type = {}
n_drive, e_drive = osm.get_network(nodes=True, network_type="driving")
n_cycling, e_cycling = osm.get_network(nodes=True, network_type="cycling")
n_walk, e_walk = osm.get_network(nodes=True, network_type="walking")
n_service, e_service = osm.get_network(nodes=True, network_type="driving+service")
graph_type['drive'] = ox.add_edge_travel_times(ox.add_edge_speeds(osm.to_graph(n_drive, e_drive, graph_type="networkx")), extra_kwargs={"hv":{"car":120}})
graph_type['walk'] = ox.add_edge_travel_times(ox.add_edge_speeds(osm.to_graph(n_walk, e_walk, graph_type="networkx")))
graph_type['cycle'] = ox.add_edge_travel_times(ox.add_edge_speeds(osm.to_graph(n_cycling, e_cycling, graph_type="networkx")))
graph_type['service'] = ox.add_edge_travel_times(ox.add_edge_speeds(osm.to_graph(n_service, e_service, graph_type="networkx")))
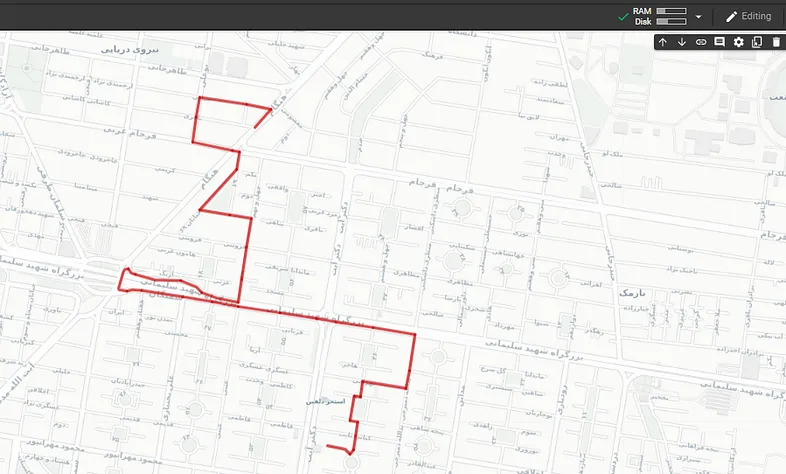
def get_route(source_geo, dest_geo, go_type='drive', weight='travel_time',plot=True):
source_node = ox.get_nearest_node(graph_type[go_type], source_geo)
target_node = ox.get_nearest_node(graph_type[go_type], dest_geo)
route = nx.shortest_path(graph_type[go_type], source_node, target_node, weight=weight)
edge_lengths = ox.utils_graph.get_route_edge_attributes(graph_type[go_type], route, 'length')
edge_travel_time = ox.utils_graph.get_route_edge_attributes( graph_type[go_type], route, 'travel_time')
total_route_length = round(sum(edge_lengths), 1)
route_travel_time = round(sum(edge_travel_time)/60, 2)
if plot:
ox.plot_graph_route(graph_type[go_type], route, node_size=0, figsize=(40,40))
return route, total_route_length, route_travel_time在 loader.py 文件中,我们将首先获取案例研究位置的数据。在本文中,我们将从南加州收集数据。 然后,我们将使用 OSM get_data 从 HDF 数据文件中获取驾驶、骑自行车、步行和公共交通 go_type 的节点和边缘。 检索到所需数据后,我们可以使用 Networkx 算法将它们转换为图。 在图中,计算从一个节点到另一个节点的距离等于边长(km / h)和从一个节点到另一个节点所需的时间(分钟)。 在最后一步中,边长和边时间将通过 osmnx 方法添加到创建的图形中,这些方法是 add_edge_speeds 和 ade_edge_travel_times。
在 get_route 函数中,我们将 source_geo、 dest_geo 和我们想要的模型作为 go_type(驾驶、骑自行车、步行或公共服务)作为输入参数,并使用 shoretest_path 获得最佳和最佳路线,即遍历这条路线所需的时间 以及这条路线的路径作为输出。
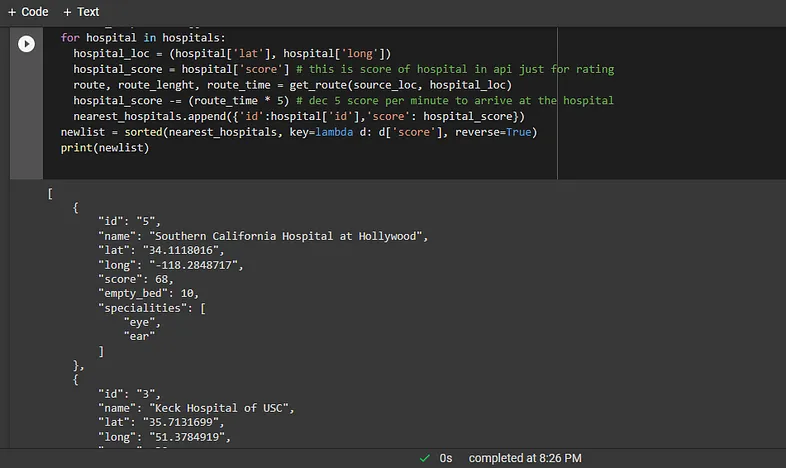
main.py:
if name == "main":
  hospitals = json.loads("hospitals.json") # read from api hospitals list
  source_loc = (34.018255, -118.313290) # just for test you must get it from gps
  nearest_hospitals = []
  for hospital in hospitals:
    hospital_loc = (hospital['lat'], hospital['long'])
    hospital_score = hospital['score'] # this is score of hospital in api just for rating
    route, route_lenght, route_time = get_route(source_loc, hospital_loc)
    # route_lenght -> distance between us and hospital in meter
    # route_time   -> duration of startpoint to hospital in minutes
    # route        -> array of point by point to hospital
    hospital_score -= (route_time * 5) # dec 5 score per minute to arrive at the hospital
    nearest_hospitals.append({'id':hospital['id'],'score': hospital_score})
  newlist = sorted(nearest_hospitals, key=lambda d: d['score'], reverse=True)
  print(newlist)
  # new list is most populer and nearst hospital from start point
在 main.py 文件中,我们加载了包含医院列表的 json 文件。 我们还找到了指示我们当前位置的源点。 更进一步,你可以看到我们到每家医院的距离都被计算出来了。 我们每分钟减少五分,从我们所在的地方到达目的地点。
在最后一步中,我们根据相应的分数对医院列表进行了排序。
恭喜! 输出列表是你周围最好的医院!
原文链接:Find The Best Route with OpenStreetMap using Python
BimAnt翻译整理,转载请标明出处